
What “Acceptable” CSA Scores Are Hiding
Below the intervention threshold doesn’t mean below the risk line. Here’s what the patterns inside your CSA data are telling insurers, shippers, and litigators.
Most fleets know where they stand on CSA. They know whether they’re above or below intervention thresholds. It has likely come up during insurance renewals. And if the numbers look acceptable, the assumption is straightforward:
We’re fine.
But an increasing number of fleets are learning that being “fine” on paper doesn’t mean they are protected from rising premiums, targeted audits, or litigation exposure. CSA isn’t just a safety score. It’s a documented record of operational patterns and risk.
The Disconnect Between Percentiles and Exposure
Consider a 325-truck regional carrier operating across the Midwest. BASIC percentiles were below FMCSA intervention thresholds. Nothing flagged. CSA reviewed quarterly, no red flags.
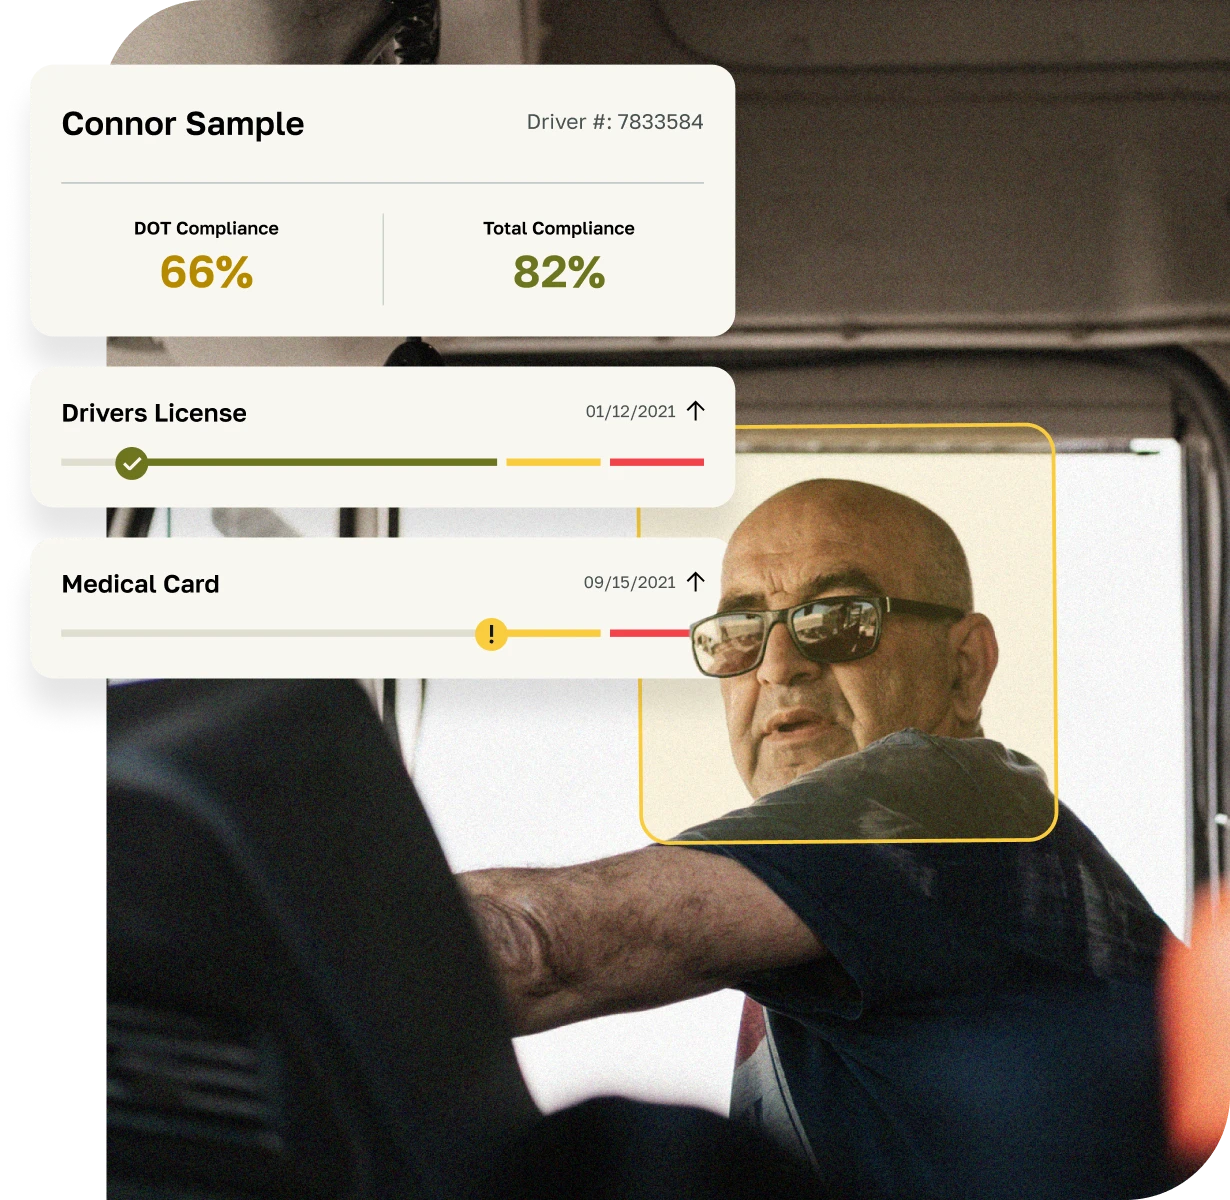
But over two quarters, Driver Fitness violations began trending upward. Expired medical certificates. Minor documentation lapses. Nothing severe enough to stand out individually.
Because the fleet remained below threshold, the trend didn’t prompt action.
Six months later, two preventable violations prompted closer scrutiny. During renewal, the insurance carrier identified the pattern and reclassified the fleet into a higher risk tier. Premiums increased mid-term.
Looking at the percentiles themselves didn’t flag the problem; It required a deeper look into the hidden patterns.
Your Score Looks Fine. But What's the Pattern Underneath?
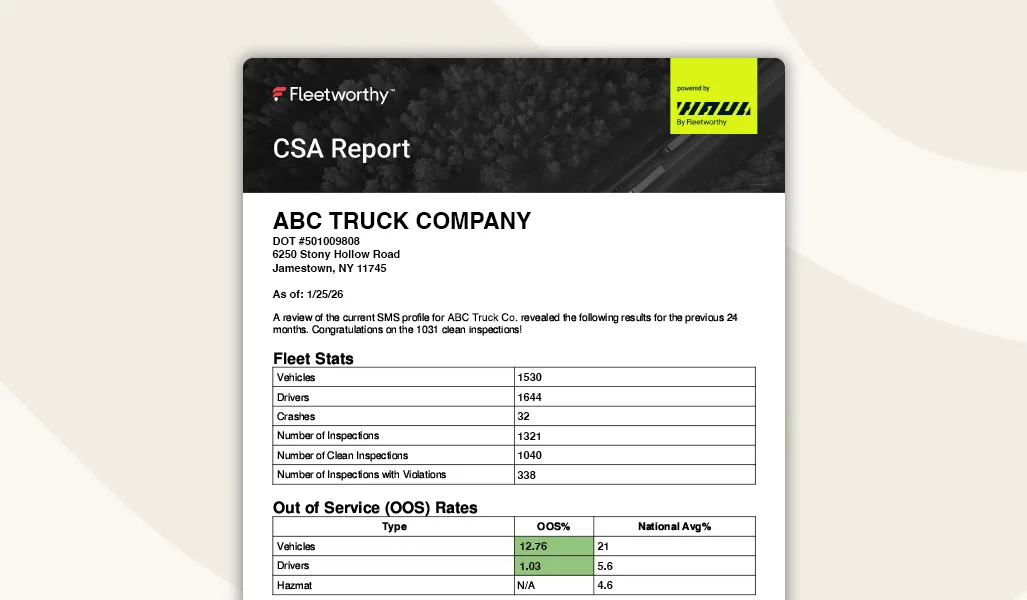
Get a free CSA Readiness Report built from your FMCSA data — and see the trends, violation patterns, and risk signals that percentiles alone don't surface.
What CSA Was Built to Do…and What It Doesn’t
CSA was designed to identify patterns of unsafe behavior and prioritize carriers for FMCSA intervention. It aggregates inspection data, crash history, and violations across BASIC categories, applying severity and time-weighting to generate percentiles.
Those percentiles are frequently treated like grades. However, they are actually benchmarks against similar fleets, not a full picture of operational health.
CSA doesn’t explain context. It doesn’t diagnose root causes. It doesn’t distinguish between a one-off event and a systemic weakness.
What it does do is surface patterns. And those patterns are increasingly being used by insurers, regulators, shippers, and plaintiff attorneys to form a view of your operation.
Where Risk Actually Builds
The most expensive CSA problems rarely start with a spike. They start with something small that doesn’t seem urgent: a missed renewal, an inconsistent log review process, a maintenance issue that surfaces a few too many times.
Individually, these events don’t trigger alarms, but over time, they form a pattern that CSA records.
That’s where the disconnect lives. Fleets manage the score but external stakeholders evaluate the story behind it.
When Patterns Point to Operational Problems
A 275-truck refrigerated carrier in the Southeast started seeing a gradual increase in Hours-of-Service violations at one terminal. Leadership attributed the trend to driver behavior — a group of newer drivers had recently been onboarded — and responded with policy reminders and increased warnings.
The violations continued and a deeper review of the CSA data unearthed something different:
That terminal had recently taken on new grocery contracts with tight delivery windows. Dispatch schedules were built with minimal buffers for delay. Internal log review processes were inconsistent, allowing early warning signs to go unnoticed.
Drivers weren’t intentionally violating regulations. They were operating inside a system that quietly pushed them toward violations.
CSA didn’t diagnose the dispatch problem. It surfaced the pattern. Once dispatch planning was adjusted and log review tightened, violations declined. The fleet corrected an operational flaw that had been quietly increasing both insurance and legal exposure.
The Risk Multiplier Most Fleets Miss
CSA is cumulative. Trends don’t disappear when issues are resolved internally. They remain part of a documented history that others can access and interpret.
Insurance underwriters use trends to assess risk trajectory, not just current standing. Shippers incorporate safety data into procurement and carrier selection decisions. In litigation, CSA histories are often used to establish narratives of systemic negligence.
A 40-truck flatbed carrier experienced a slow accumulation of minor maintenance violations: brake adjustments, lighting defects, routine inspection findings. They remained below intervention thresholds throughout. No warnings were issued.
After a serious crash, plaintiff attorneys reviewed the carrier’s CSA history and used the repeated maintenance findings to argue systemic failure. While the individual violations weren’t the issue, the documented pattern that was left unresolved became the sticking point.
Score Management vs. Risk Visibility
There’s a meaningful difference between managing CSA and understanding what it’s telling you.
Reactive fleets watch percentiles. They respond when thresholds approach, correct individual violations, and hope the numbers stabilize.
More proactive fleets operate differently. They study trends over time. They focus on repetition and severity. They connect CSA data to operational workflows — dispatch, maintenance, onboarding, and coaching. They document corrective actions and verify that patterns actually resolve.
They don’t treat CSA as a score to manage. They treat it as an early-warning system.
Stop Managing the Score. Start Understanding the Risk.
Our team will analyze your DOT data and deliver a custom report showing exactly where risk is building — before it shows up in your premiums, audits, or claims.
Why Interpretation Is the Differentiator
CSA reports don’t prioritize which trends carry the greatest exposure or connect dots between operational silos. Interpreting them correctly requires more than reading percentiles. It requires understanding how enforcement views patterns, how insurers assess trajectory, and how litigators frame historical data.
Without that context, fleets often chase symptoms, correcting visible issues while underlying risks continue to build. With the right interpretation, CSA becomes something considerably more useful: a way to see risk before it becomes cost.
The Question Worth Asking Now
By the time CSA patterns surface in a renewal conversation, an audit, or a claim, they’ve usually been building for months, sometimes years. The question isn’t whether risk exists. It’s whether you can see it early enough to act.
A few things worth considering:
- Are you reviewing CSA trends consistently, or only when something spikes?
- Do you know which patterns in your data carry the greatest financial and legal exposure?
- Could you clearly demonstrate corrective action if your operation were scrutinized today?
See What the Score Doesn’t Show You
CSA was never designed to be a final answer. It was designed to point you toward the right questions.
Fleets that look beyond percentiles and examine the patterns underneath are better positioned to control costs, reduce exposure, and get ahead of issues before they escalate.
For fleets that want to understand what their CSA data is actually signaling, a deeper review can surface risks that aren’t immediately visible in the numbers. In many cases, those insights can arrive just in time — before the next renewal, audit, or incident forces the conversation.
Get Ahead of What's Coming.
A free, custom CSA Readiness Report gives you a clear view of your fleet's risk exposure, violation trends, and operational gaps — so you can act before the next renewal, audit, or incident forces the conversation.